The objective of this Test Case is to simulate a real scale experiment in order to compare CFD results with measurements and evaluate ventilation performance regarding back-layering effect. Two different test cases are simulated, pool fire is a heat source, and the worst case is computed with the heat release rate taking its maximum value from the beginning till the end of the simulation. This verification test was conducted in the context of Eurostars Project TUNFEC (Structural and aerodynamic design of TUNnels under Fire Emergency Conditions).
Two Reynolds averaged Navier-Stokes (RANS) turbulence models are used; the low-Re k-ω SST and the standard k-ε model with wall function treatment. The varied parameters were the heat release rate and the ventilation rate. Results predicted by the two turbulence models are compared. The overall performance of the low-Re k-ω SST turbulence model to the less computationally demanding standard k-ε turbulence model with wall functions has been examined.
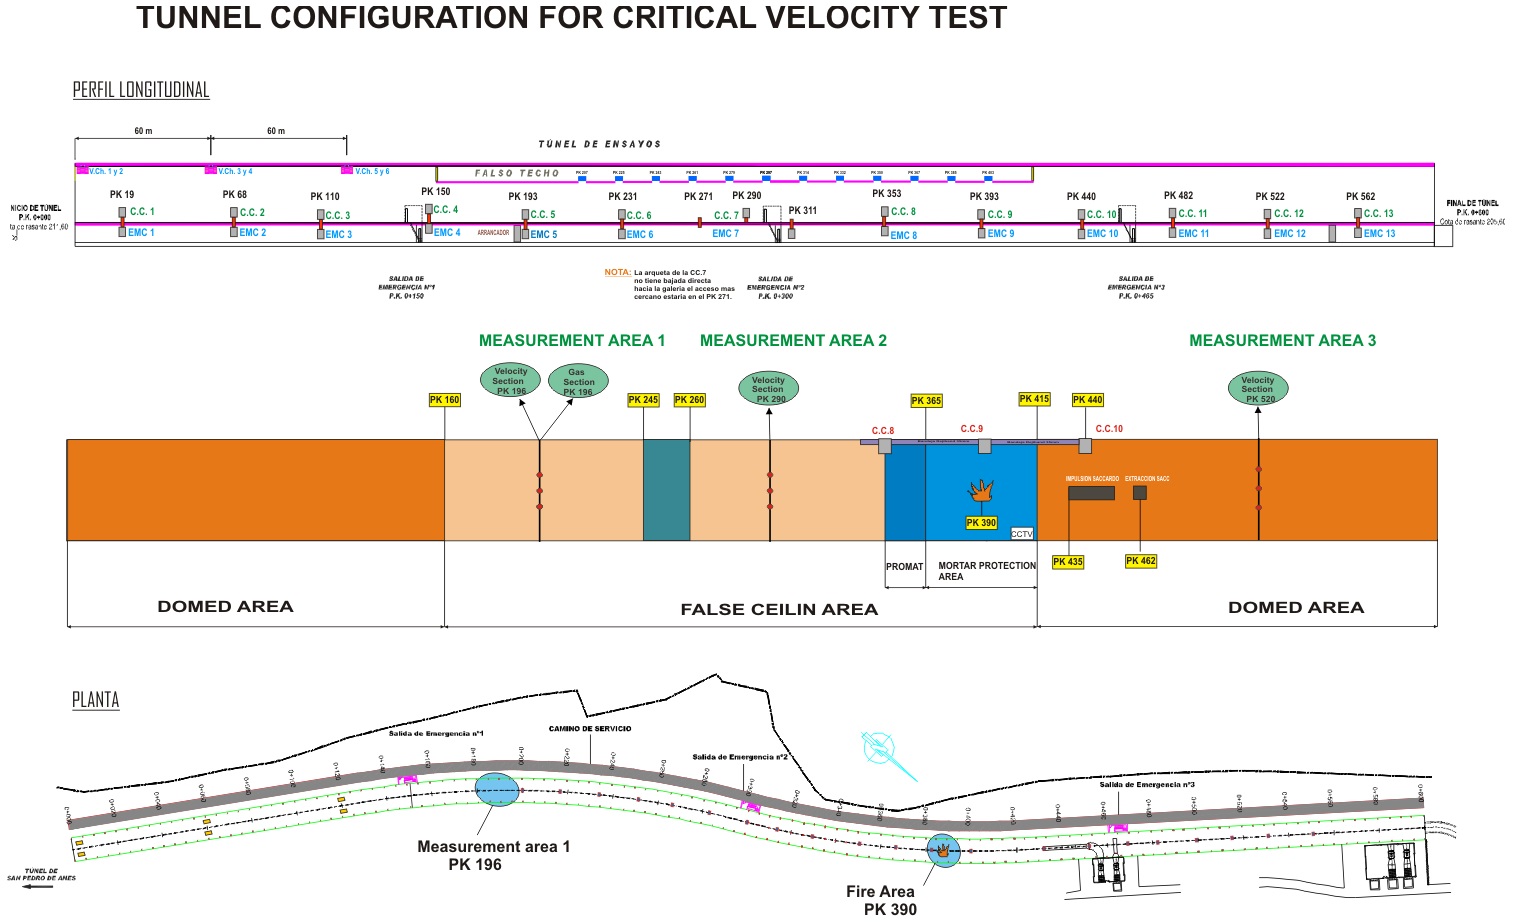
Tunnel configuration for critical velocity test
Tunnel fire/smoke evolution - Heat Source
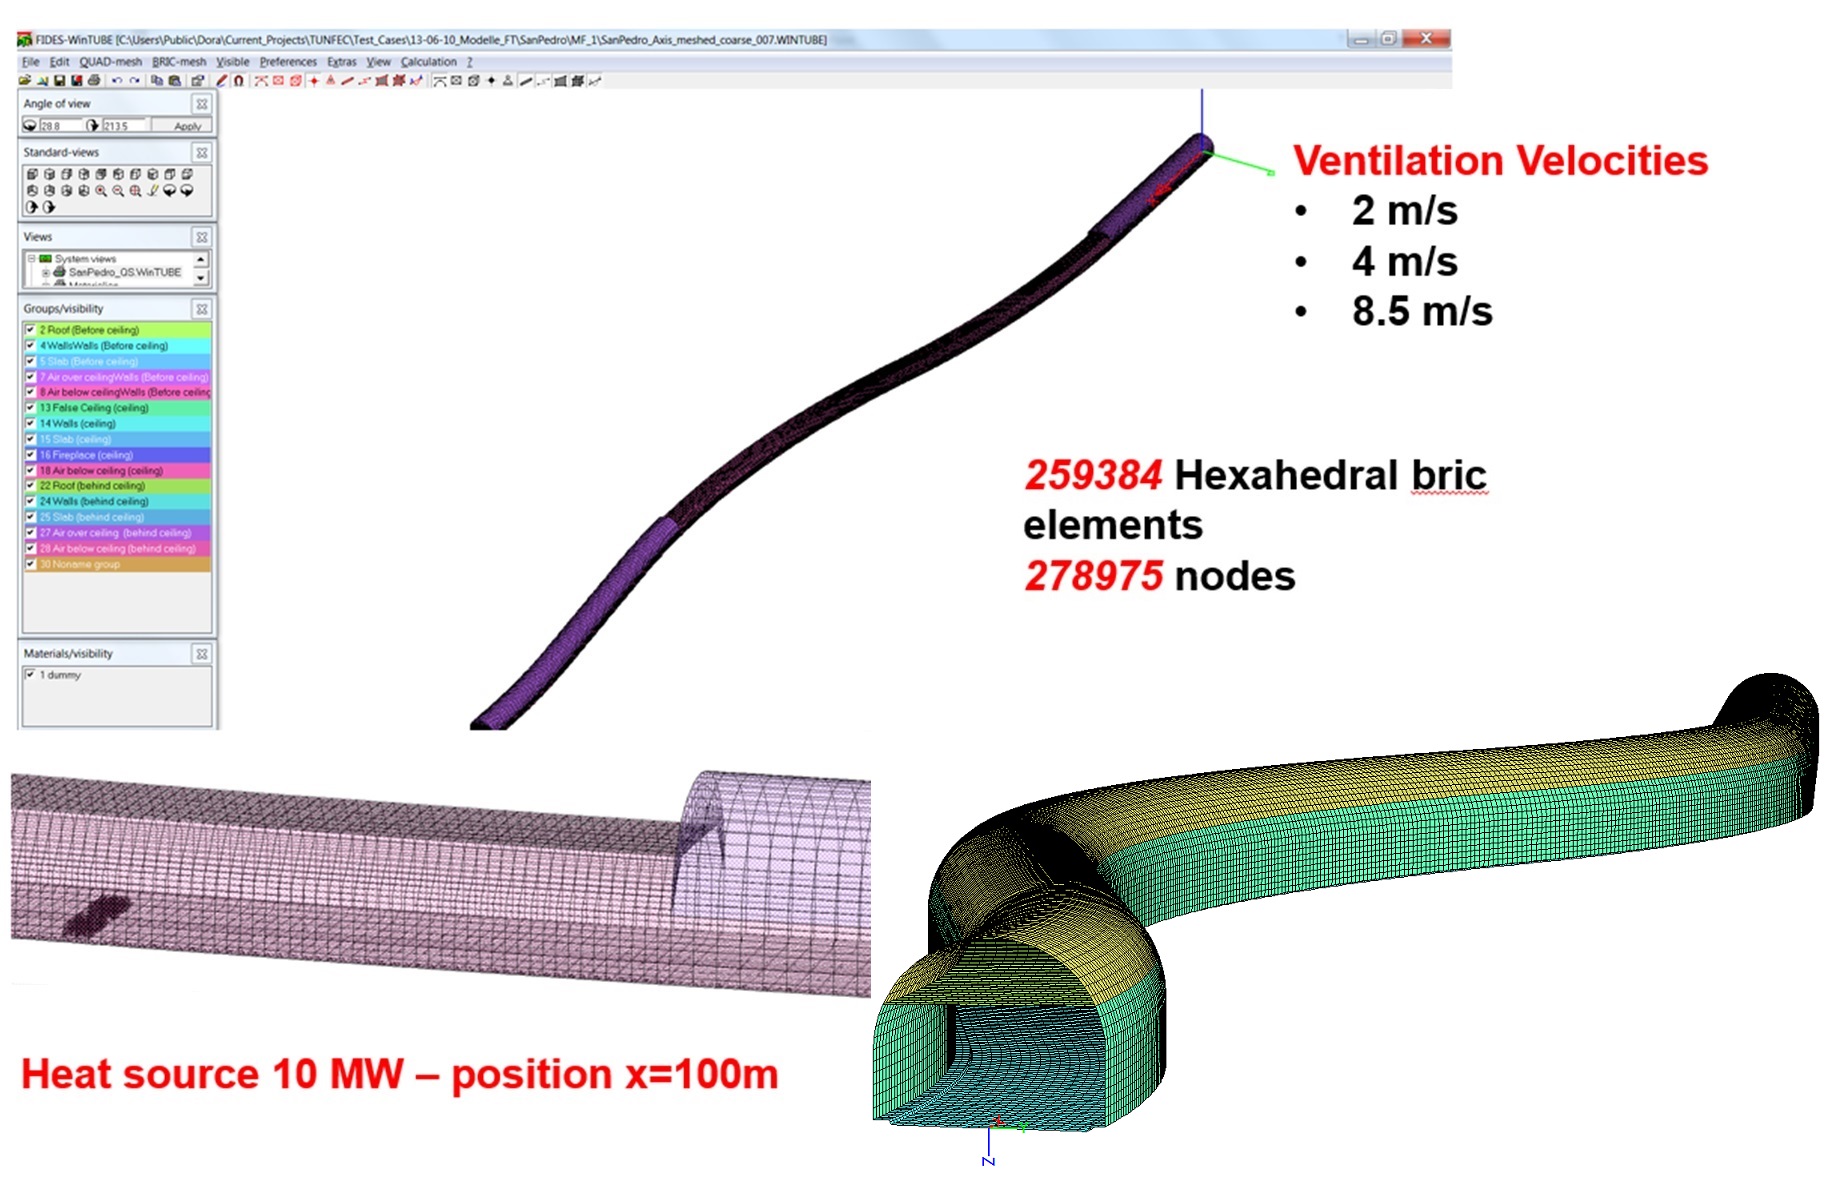
WinTUBE model and numerical mesh
One of the most important characteristics of a numerical model is the accurate prediction of the backlayering length and critical velocity in order to prevent backlayering effect. The distance of the smoke front from the heat source is the backlayering length. The most dangerous factor for human lives in tunnel fires is not the extreme temperatures produced, but the excess of the concentration limits of combustion products. Therefore the appropriate ventilation system is required for the smoke control. The critical velocity refers to longitudinal ventilation systems. This ventilation system type leads smoke to tunnel's exit, ensuring the safe escape of passengers through the tunnel's entrance. The ventilation system should prevent backlayering, but high ventilation velocities feed the fire with more oxygen, augmenting the heat release rate and increase the resistance to the passengers, reducing the escaping rate. The lowest ventilation velocity that could prevent smoke backlayering is the coveted critical ventilation velocity.
Alternative modeling of ventilation systems
Addition of a momentum source to model thrust of jet fans
Ventilation of tunnel (without fire)
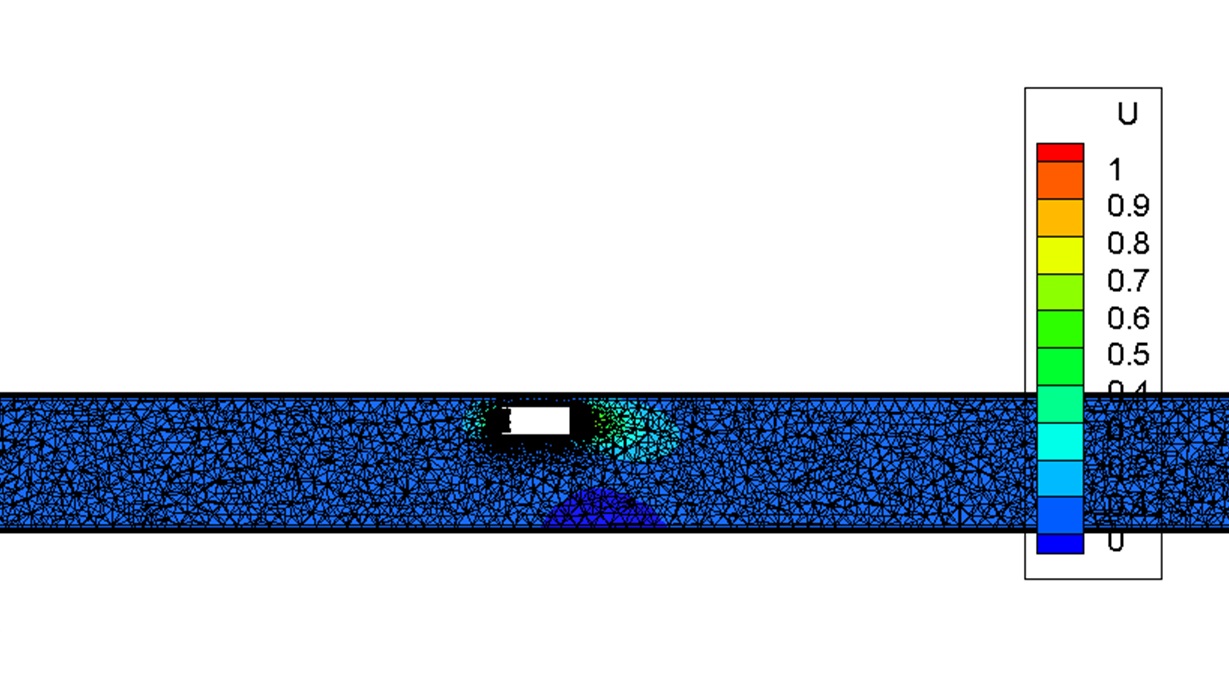
HRR of fire is constant, equal to 10MW. Two ventilation velocities, 2m/s and 4m/s at the tunnel inlet are simulated. A numerical mesh of 259384 hexahedral elements and 278957 nodes was used for the discretization of the flow field. The basic characteristics of the flow predicted by the two turbulence models appear to be plausible. Smoke plume is heated at the region of the heat source, raises up and separates at the ceiling of the tunnel. High temperature smoke moves along the ceiling, whereas cool air moves at the lower part of the tunnel. A part of smoke moves to the tunnel inlet for a distance, which is affected by the ventilation velocity.
The numerical results are in very good agreement to the experimental measurements. Specifically:
For the ventilation of 2m/s the backlayer of the flow is dominant.
For the ventilation of 4m/s the backlayer is prevented.
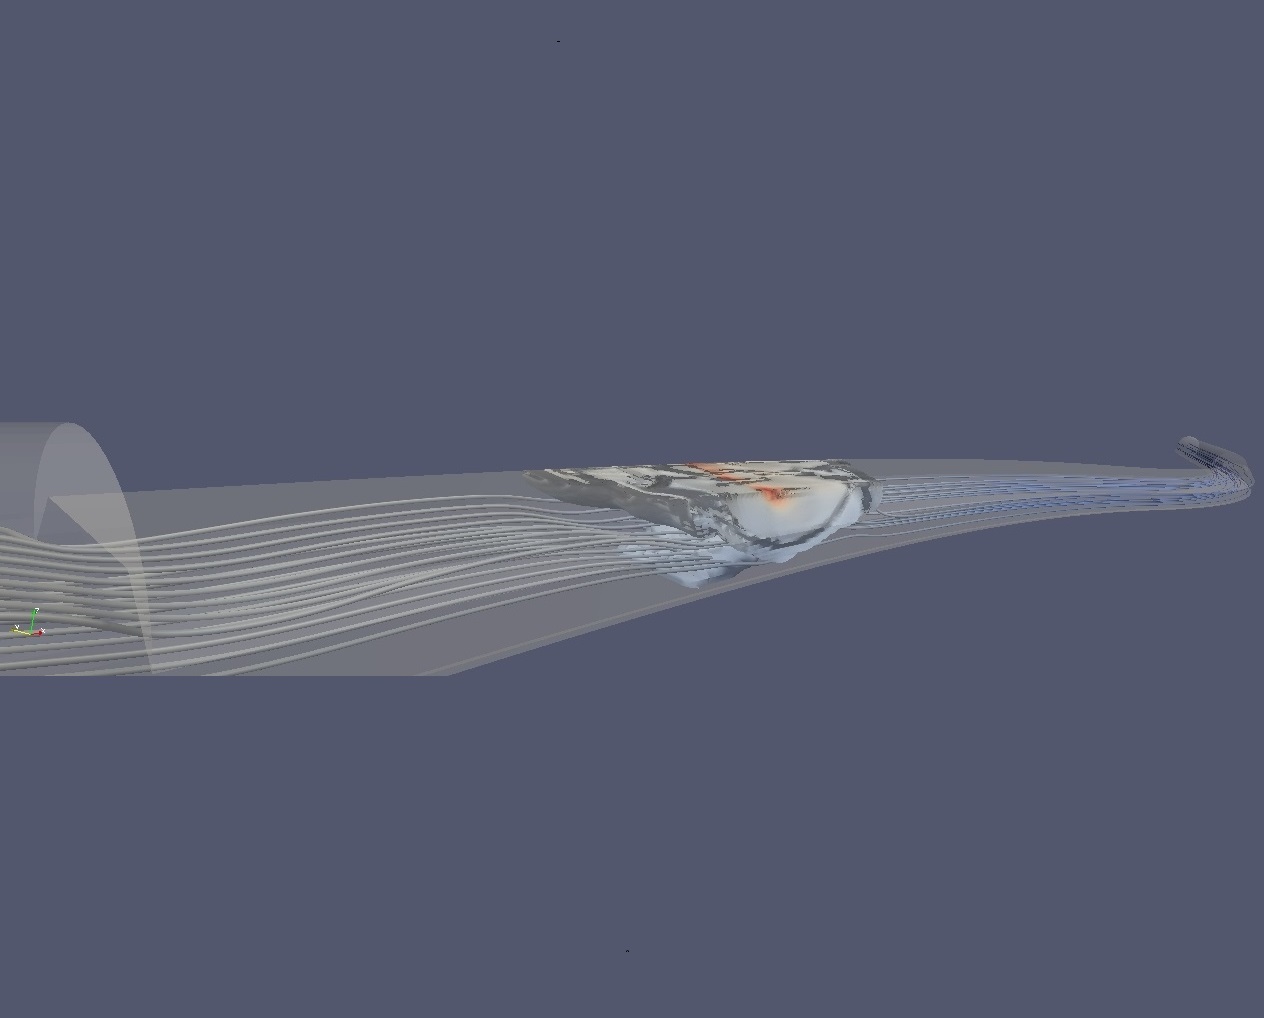
The buoyant character of the flow is evident.
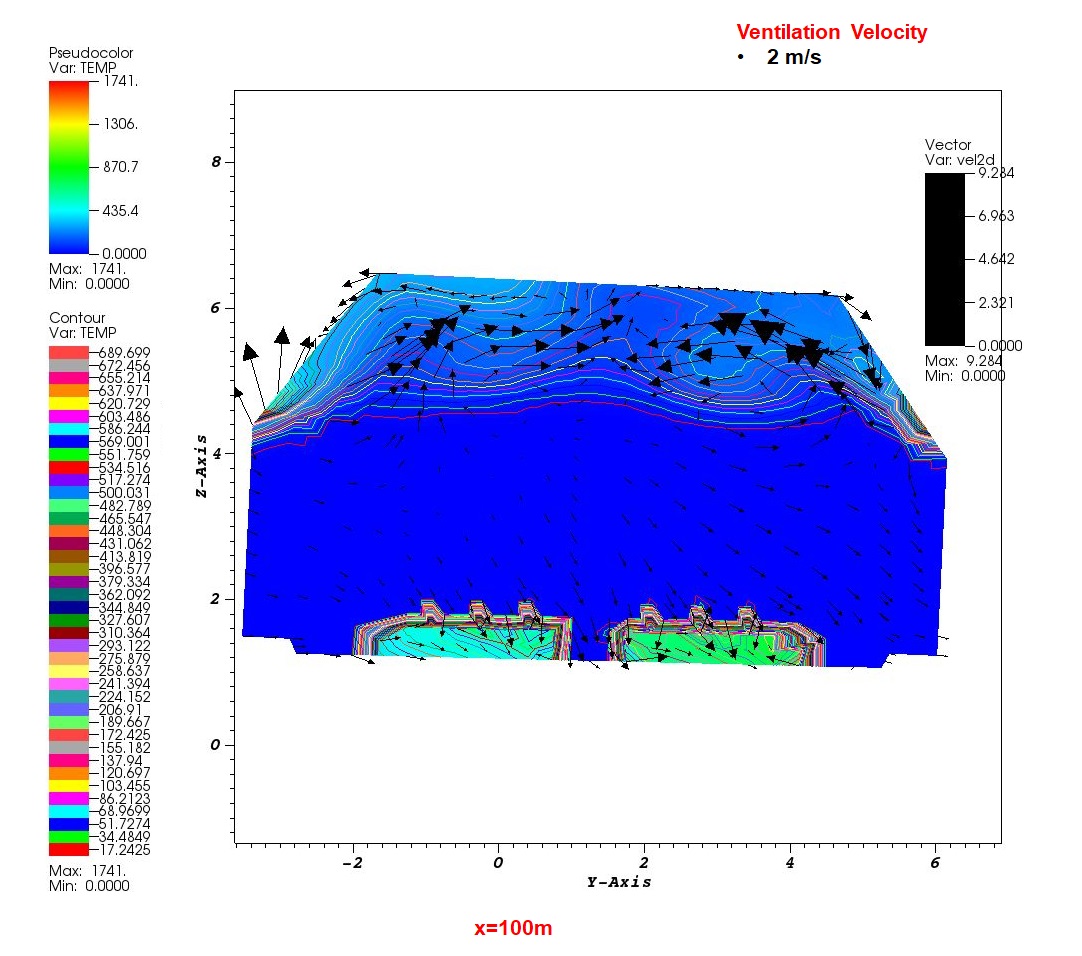
High velocities of similar magnitude are developed in the vicinity of fire due to buoyancy effects.
The numerical and experimental velocity and temperature distributions on specific measurement areas are in very good agreement.
Flow buoyant character and flow field characteristics are depicted in the following figures.
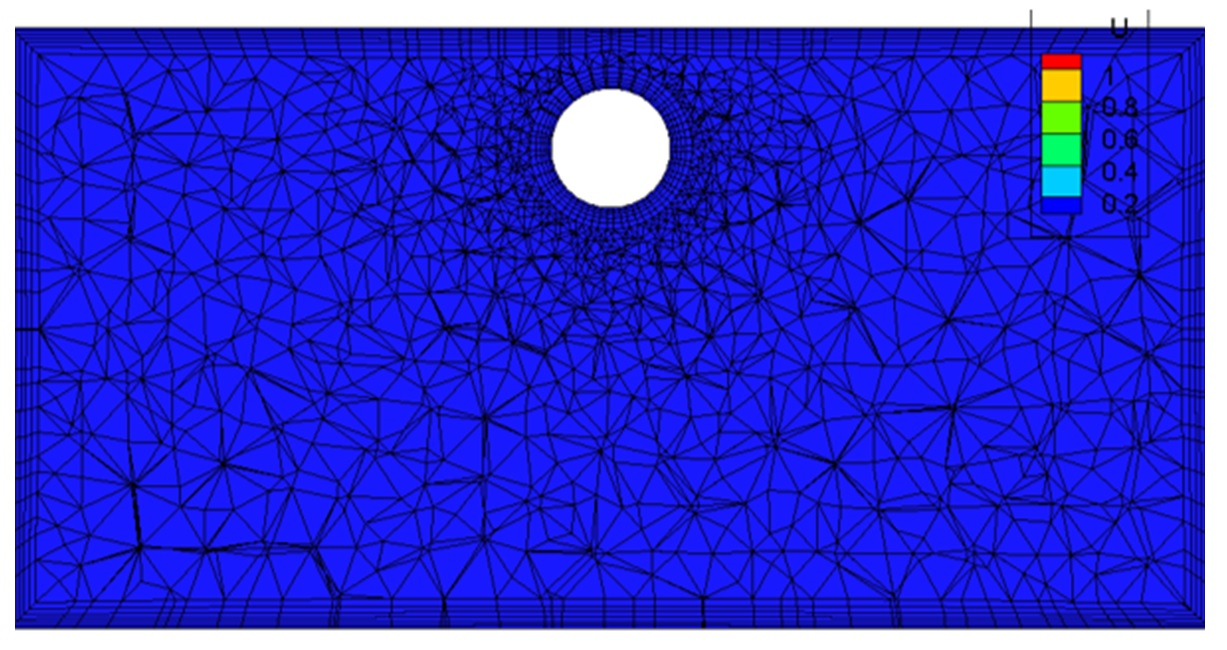
Air velocity and temperature field on transverse cross section of the tunnel (x=100m)
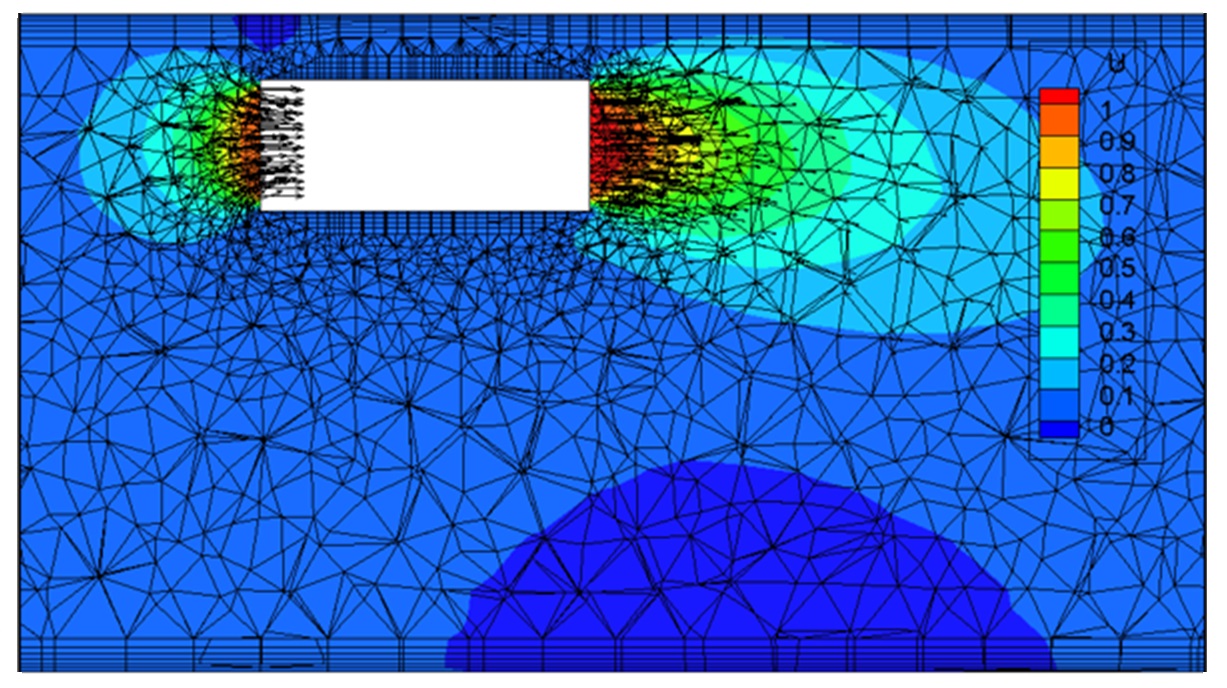
Air velocity and temperature field on transverse cross section of the tunnel (x=102m)
Stream lines with temperature contours and backlayering effect
Smoke and Temperature at 2m/s air ventilation speed
Smoke and Temperature at 4m/s air ventilation speed
Smoke and Temperature (4 views) at 4m/s air ventilation speed